Single-cell dissection of obesity-exercise axis in adipose-muscle tissues
Regular physical exercise is critical for the prevention and treatment of
obesity. Dissecting the underlying molecular mechanisms that mediate these
beneficial effects of exercise has been challenging because of the technical
barriers to simultaneously investigate heterogeneous responses on the molecular,
cell type-specific, and cross-tissue levels. Here, we address this challenge by
studying the opposing effects of exercise training and high-fat diet induced
obesity at single-cell, deconvolution and tissue-level resolutions across 3
metabolic tissues. We profile scRNA-seq in 204,883 cells, grouped into 53
distinct cell subtypes/states in 22 major cell types, from subcutaneous and
visceral white adipose tissue (WAT), and skeletal muscle (SkM) in mice with diet
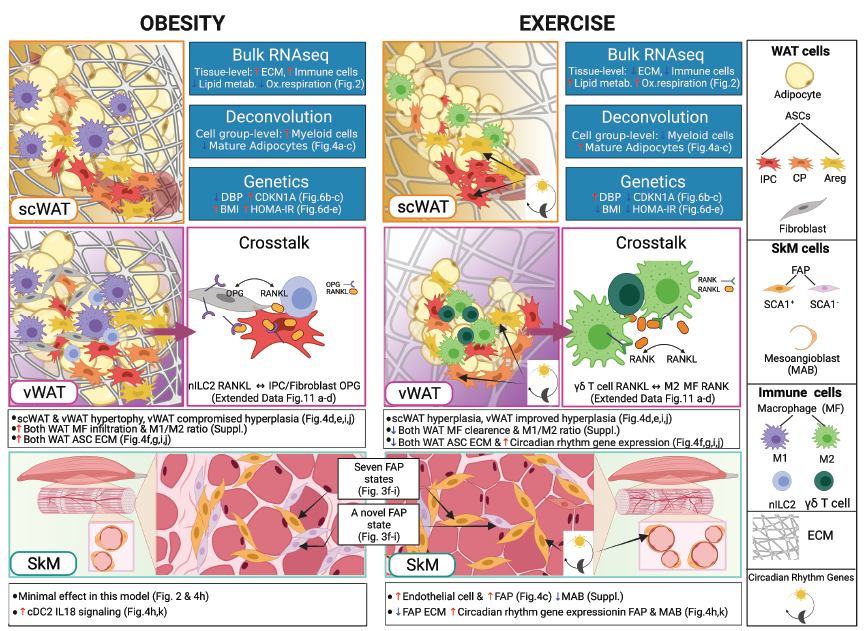
and exercise training interventions. Despite the complex responses observed, we
identify a prominent role of mesenchymal stem cells (MSCs) in mediating the
exercise and obesity-induced adaptations in each tissue. Adipose stem cells
(ASCs, the MSCs for WAT), show distinct profiles for scWAT compared to vWAT in
terms of transcriptional diversity and regulons. In SkM we identify seven
distinct fibro-adipogenic progenitors (FAPs, MSCs for SkM) including discovery
and validation of a novel SCA1- FAP population. Among the pathways regulated by
exercise and high-fat diet in MSCs across the three tissues, extracellular
matrix remodeling and circadian rhythm are the most prominent. Cell-cell
interactions also implicate complex within- and multi-tissue crosstalk centered
around MSCs. Overall, our work reveals the intricacies and diversity of
multi-tissue molecular responses to exercise training and obesity and uncovers a
previously underappreciated role of MSCs in mediating tissue-specific and
multi-tissue effects.
Jiekun Yang, Maria Vamvini, Pasquale Nigro, Li-Lun Ho, Kyriakitsa Galani,
Marcus Alvarez, Yosuke Tanigawa, Ashley Renfro, Nicholas P. Carbone, Markku
Laakso, Leandro Z. Agudelo, Päivi Pajukanta, Michael F. Hirshman, Roeland J.W.
Middelbeek, Kevin Grove, Laurie J. Goodyear, Manolis Kellis,
Single-cell dissection of the obesity-exercise axis in adipose-muscle tissues
implies a critical role for mesenchymal stem cells, Cell
Metabolism, Volume 34, Issue 10, 2022, Pages 1578-1593.e6, ISSN 1550-4131,
https://doi.org/10.1016/j.cmet.2022.09.004.
(https://www.sciencedirect.com/science/article/pii/S1550413122003941)
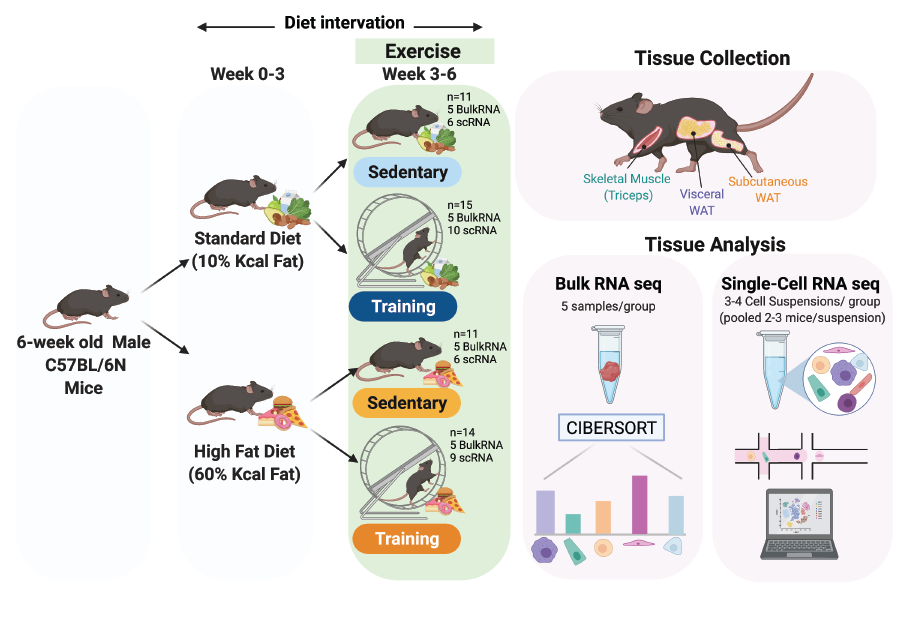
Experimental design
Cell information vs gene expression on reduced dimensions
In this tab, users can visualise both cell information and gene expression side-by-side on low-dimensional representions.Dimension Reduction
Cell information vs cell information on dimension reduction
In this tab, users can visualise two cell informations side-by-side on low-dimensional representions.Dimension Reduction
Gene expression vs gene expression on dimension reduction
In this tab, users can visualise two gene expressions side-by-side on low-dimensional representions.Dimension Reduction
Coexpression of two genes on reduced dimensions
In this tab, users can visualise the coexpression of two genes on low-dimensional representions.Dimension Reduction
Cell information / gene expression violin plot / box plot
In this tab, users can visualise the gene expression or continuous cell information (e.g. Number of UMIs / module score) across groups of cells (e.g. libary / clusters).Proportion / cell numbers across different cell information
In this tab, users can visualise the composition of single cells based on one discrete cell information across another discrete cell information. Usage examples include the library or cellcycle composition across clusters.Gene expression bubbleplot / heatmap
In this tab, users can visualise the gene expression patterns of multiple genes grouped by categorical cell information (e.g. library / cluster).The normalised expression are averaged, log-transformed and then plotted.
This webpage was made using ShinyCell
About:
- Manuscript on bioRxiv: https://www.biorxiv.org/content/10.1101/2021.11.22.469622v1
- Contact: Jiekun (Jackie) Yang jkyang@mit.edu